
Do you think you offer value for money? No matter how luxurious or amazing a property/holiday/
location/experience, guests can be pretty harsh when asked to rate the “value” of their stay. Even if you’ve gone above and beyond, catered to their every need and they’ve had the holiday of a lifetime, it’s the one thing they’re most likely to mark you down on when asked for feedback.
Should you increase your prices?
And all this plays into the mix when it comes to setting your prices for the next year. Many self-catering accommodation providers try to tread a fine balance when it comes to their pricing and we’re often asked for advice on this subject. What are most self-caterers doing next year? Should we increase our prices? By how much?
It’s impossible to give a definite answer to these questions, and what works for one business won’t necessarily work for the next. However, we’ve had a look back at what our customers have done over the past few years to see if they can provide any clues regarding what to do (our data includes properties only in the UK and Northern Ireland).
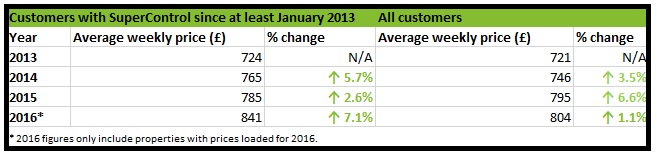
As the above table shows, the average weekly price has risen each year since 2013. If we look at the businesses that have been using SuperControl since at least January 2013, their average weekly prices have risen by £117 during this period (around 16%). If we look at the pricing information for all SuperControl customers, regardless of how long they have been using our system, the average weekly price has also risen each year but only by £83 overall (around 12%).
Looking at what lies ahead for 2016, long-term SuperControl users are pushing up their prices quite substantially (around 7%). However, if we take the average weekly price of all SuperControl users, prices are set to rise next year, but only by around 1%.
Pricing in detail
In order to make this article as relevant as possible to your particular property type and size, we’ve delved deeper into the stats bank to break this down some more:
1. By capacity
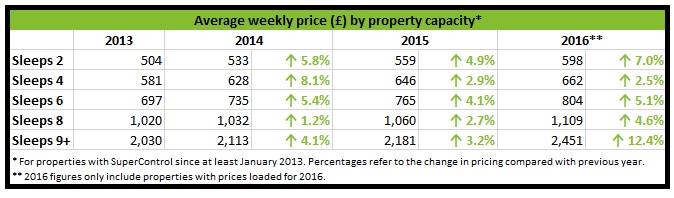
Prices have risen quite steadily over the past few years for properties of all sizes. However, the larger properties that sleep 9+ look set to see the most significant jump in prices next year of 12.4%.
2. By location
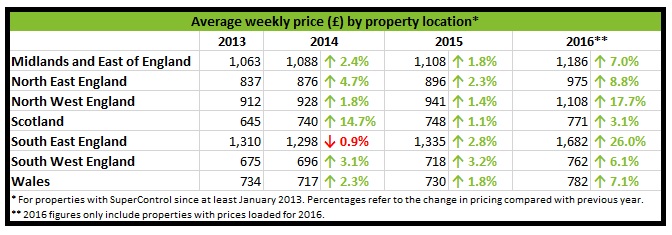
Unsurprisingly, the highest prices have consistently been seen across the South East, which includes London. However, the average prices in this region dropped slightly in 2014. Elsewhere, prices have risen consistently each year and they look set to rise across the board next year too, with prices in the South East and the North West expected to see the biggest increases of 26.0% and 17.7%, respectively.
Bear in mind, however, the average 2016 prices are only rough estimates, as our figures for next year only include properties with prices loaded for 2016. Some of our accommodation providers have not yet updated their pricing that far ahead, so the average prices are subject to change. It’s also worth noting that more expensive properties seem to be planning further ahead. If you’re reading this and have just realised you are one of these owners, now’s the time to update your prices, so you don’t miss out on any future bookings!
What will you do?
Hopefully these stats might help you when it comes to setting your prices in future. Our blog on the average cost of self-catering accommodation in Britain should hopefully offer further insight. But, what’s your strategy when it comes to pricing? What would you advise? We’d love to hear from you.


